North America is entering a period of rapid electricity demand growth while electricity supply has remained largely unchanged for years. In the United States, total electricity generation reached 4,240 TWh in 2023, according to the U.S. Energy Information Administration (1). Early federal data for 2024 shows that generation remained within a narrow band of roughly 4,150 to 4,200 TWh, indicating that overall supply has been flat even as multiple sectors report strong increases in expected consumption (2).
Canada has experienced a similar stagnation, although for different reasons. Statistics Canada reports that national electricity generation totaled 636.2 TWh in 2022 (3). Output then declined to 615.3 TWh in 2023, and monthly data for 2024 adds up to approximately 609.5 TWh, marking a second consecutive annual decrease (4). The official explanation for this reduction is drought-related stress on hydroelectric facilities, which constrained water availability and reduced output, particularly in British Columbia and Quebec. System operator data shows that demand remained relatively stable during this period, which means the observed decline is primarily a supply-side issue rather than evidence of reduced consumption.
Combined, the United States and Canada produced just under 4,800 TWh of electricity in 2024. This total is nearly identical to what the continent generated in 2021, despite the fact that federal energy regulators and system planners in both countries now expect some of the strongest electricity demand growth in more than fifty years (5). The continent is therefore starting a period of unprecedented load growth from a position of near-zero supply growth.
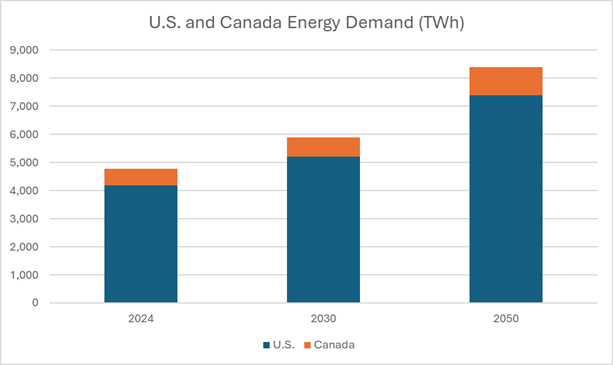
Electricity demand across North America is rising at a pace that exceeds earlier expectations, and the revised forecasts from official sources show a fundamental shift in the scale of required generation. In the United States, the Energy Information Administration now projects that national electricity use will reach new record highs in 2025 and 2026, driven by increases across data centers, manufacturing, electrified heating, and transportation (6). In parallel, analysis by ICF estimates that U.S. electricity demand will grow by approximately 25 percent by 2030 compared with 2023, with long term increases of nearly 78 percent by 2050 (7). These projections represent the most significant load growth outlook the United States has published in decades.
Data center expansion is one of the strongest contributors. The U.S. Department of Energy notes that data centers consumed roughly 176 TWh in 2023, and under current investment trajectories, demand could reach 325 to 580 TWh by 2028 (8). Growth in artificial intelligence infrastructure, high performance computing, and cloud services is accelerating this trend, concentrating substantial new loads in regions such as Virginia, Ohio, Texas, and the Pacific Northwest.
Canada faces similar pressures. The Canada Energy Regulator’s most recent long term outlook projects that national electricity generation will need to rise from approximately 610 TWh in 2024 to roughly 680 TWh by 2030, and to between 970 and 1,000 TWh by 2050 under the Current Measures scenario (9). Demand rises even higher in the agency’s net zero pathways. These increases reflect population growth, electrified transportation, industrial investment, clean technology development, and a broader shift toward electricity as the primary energy carrier for buildings.
When combined, the United States and Canada are expected to require nearly 1,000 TWh of additional electricity by 2030 and between 2,000 and 3,500 TWh of new annual generation by 2050. These figures come directly from national energy regulators and are consistent with the independent analyses now driving planning discussions across system operators and utilities (10). North America has not built new supply anywhere near this scale in recent decades, which creates a widening gap between projected load and available generation.
The electricity systems of the United States and Canada are physically interconnected but institutionally fragmented. In the United States, oversight is divided among federal regulators, state public utility commissions, local authorities, and independent system operators. Each region manages its own planning framework, resource mix, reliability standards, and market structure. Canada operates under a similarly decentralized approach in which provinces control generation, transmission, and permitting through separate regulatory and policy regimes. There is no continental planning body, no unified development strategy, and no coordinated buildout designed to meet the collective demand increases both countries now face.
This fragmentation complicates long horizon supply planning at precisely the moment when the underlying forecasts show that North America’s electricity system will need to expand faster than at any point in the last half century. United States generation must rise from about 4,200 TWh today to more than 5,000 TWh by 2030 according to the Energy Information Administration (11). Canada must increase from roughly 610 TWh to about 680 TWh in the same period according to the Canada Energy Regulator (12). Combined, the continent must add nearly 1,000 TWh of supply by 2030, a scale that is comparable to adding an electricity system larger than the entire Canadian grid within six years (13).
The cross-border relationship adds an additional layer of complexity. Canada currently exports approximately 36 TWh of electricity to the United States each year (14). These exports are significant for certain regional grids but remain very small relative to the expected increases in North American demand. If Canada intends to expand its role as a continental supplier, it will need to resolve the policy tensions that have shaped Canada–United States relations in recent years and demonstrate that its planning, permitting, and investment systems can support material growth in generation. Without a more coherent framework, the continent must attempt to meet a shared load challenge through disconnected strategies.
Nuclear generation provides a useful reference point for understanding the scale of the electricity additions that North America will need over the coming decades. A modern large scale reactor such as the AP1000 typically produces 8 to 10 TWh of electricity each year at standard capacity factors (15). Small modular reactors provide helpful comparison points as well. A three hundred megawatt design such as the BWRX-300 produces roughly 2 to 2.2 TWh per year when operated at expected performance levels (16). These figures allow straightforward translation between long term demand forecasts and the number of completed projects required to meet them.
North American construction timelines further inform the scale of the challenge. Recent U.S. and Canadian experience indicates that large reactors often require 8 to 12 years from licensing to operation, with total project costs that commonly reach tens of billions of dollars (17). Even small modular reactors, although simpler to deploy, still require multi year development timelines and substantial capital commitments. In contrast, verified construction records compiled by the International Atomic Energy Agency show that China frequently completes large reactors within approximately 5 years from first concrete to grid connection (18). China also has more than 20 reactors currently under construction, while the United States and Canada have none (19).
These output values and timelines help quantify the scale of the continental requirement. By 2030, the United States and Canada will need nearly 1,000 TWh of additional electricity each year. Meeting that requirement would be equivalent to deploying roughly 100 to 130 large reactors such as the AP1000 or approximately 450 to 500 small modular reactors of the BWRX-300 size (20). By 2050, projected additions rise even further. North America will require between 2,000 and 3,500 TWh of new annual generation, equivalent to roughly 200 to 350 large reactors or between 900 and 1,700 small modular reactors (21). These comparisons do not imply that nuclear must supply this energy. They illustrate the scale of the additions required, regardless of technology.
Canada is adding new generation capacity, but the scale of these projects remains small relative to the country’s long term requirements. The proposed hydroelectric project near Iqaluit in Nunavut illustrates this point. Government and regional assessments indicate that the facility would produce between 15 and 30 MW of continuous power, equal to roughly 0.13 to 0.26 TWh of electricity each year (22, 23). The project is expected to cost between 400 and 500 million dollars and would not enter service before 2033 under the current schedule (24). This represents a transformative shift for Iqaluit, which relies heavily on diesel, but it is not meaningful at the scale required for Canada’s forecasted additions. The Canada Energy Regulator projects that Canada will need approximately 300 to 350 TWh of additional annual generation by 2050 under its Current Measures scenario (25). Achieving that level of new supply with facilities similar to the Iqaluit project would require well over one thousand such developments.
Larger projects demonstrate the same pattern. Ontario Power Generation plans to build up to 4 units of the BWRX-300 small modular reactor at Darlington, with each unit expected to generate about 2 to 2.2 TWh of electricity per year (26, 27). A full four unit deployment would therefore provide roughly 8 to 9 TWh annually, a useful addition to Ontario’s grid but still only a small portion of Canada’s long term requirement. The proposed Bruce C nuclear expansion, which could add up to 4,800 MW of new capacity, would generate roughly 38 to 40 TWh per year at typical performance levels (28). Even so, meeting Canada’s 2050 demand growth would require 8 to 10 projects of this scale. Site C in British Columbia provides a final reference point. With a capacity of 1,100 to 1,200 MW, it will generate about 5.1 TWh annually and carries a final cost estimate above 16 billion dollars (29). Replicating Site C enough times to meet national requirements would involve dozens of projects and more than one trillion dollars in cumulative capital costs if pursued through hydro alone. These examples demonstrate that Canada is building, but the national scale of required additions far exceeds the size of the projects currently underway.
China provides a clear reference point for what can be achieved when a national electricity system aligns planning, permitting, transmission development, and capital deployment under a unified framework. Verified data from the International Energy Agency and China’s national energy authorities show that the country adds between 150 and 200 GW of new generation capacity every year across nuclear, hydro, wind, and thermal technologies (30). These additions translate into roughly 100 to 200 TWh of new annual electricity production, an amount comparable to the total output of many advanced economies (31).
Nuclear development offers the most striking comparison. Construction records maintained by the International Atomic Energy Agency show that China frequently completes large reactors in about 5 years from first concrete to grid connection, significantly faster than the 8 to 12 year timelines typical in the United States and Canada (32). China also has more than 20 reactors currently under construction, including multiple AP1000 and Hualong One units (33). North America has none. Within a single decade, China can add the equivalent of two or three Canadas worth of electricity generation (34). North America does not need to mirror China’s pace or structure, but the comparison underscores how quickly capacity can grow when national strategies are aligned with system level objectives.
The scale of the coming electricity deficit creates one of the most significant economic and industrial opportunities in North America in decades, especially for Canada. The country begins with strong structural advantages. Its grid is already among the cleanest in the world, with more than 60 percent of national electricity generated from hydroelectric facilities (35). Canada also has a long history of nuclear development, a stable regulatory environment, and large regions with the technical potential for expanded hydroelectric and nuclear capacity.
The United States, meanwhile, remains the largest electricity market in the world outside China. Total generation reached 4,240 TWh in 2023 and is projected to exceed 5,000 TWh by 2030 (36). Canada already exports approximately 36 TWh of electricity to the United States each year (37). These exports matter for regional reliability but are small relative to the scale of U.S. demand growth. If Canada chooses to expand its generation footprint significantly, it could become a long term partner for U.S. regions facing rapid load increases from data centers, manufacturing, electrified heating, and transportation. Existing interties between Canadian provinces and U.S. states could support larger flows if supply increases.
This opportunity exists, but taking advantage of it will require rebuilding policy alignment with the United States. The bilateral relationship has become more strained in recent years because of trade disputes, industrial policy differences, and inconsistent permitting regimes (38). These tensions affect cross border transmission planning and electricity trade. If Canada wants to play a larger continental role, it must demonstrate that its permitting, planning, and investment systems can support sustained growth in electricity supply and provide long term reliability to American buyers.
The numbers clarify the stakes. North America currently generates about 4,800 TWh per year. By 2030, the continent will require nearly 1,000 TWh of additional supply. By 2050, the requirement rises to between 2,000 and 3,500 TWh, which is equivalent to adding Canada’s electricity system once, then adding it again, and in the higher scenarios adding half of it a third time (39). These figures come directly from federal energy regulators in both countries and reflect the most comprehensive demand forecasts now available (40). Meeting this challenge will require long horizon planning, large scale capital deployment, and a level of coordination that has not characterized North American electricity policy in recent decades.
If the continent builds at the scale its own forecasts require, the benefits will be substantial. New supply will support advanced manufacturing, data infrastructure, electrified mobility, and cleaner industrial processes. It will improve grid reliability and strengthen economic competitiveness. Canada in particular has an opportunity to meet its own needs and support the United States at a moment when American demand is accelerating. The next decade will determine whether North America moves decisively to close the emerging supply gap or continues on a path where demand outpaces generation and constrains growth.
Sources:
(1) U.S. Energy Information Administration (EIA). “Electricity Data Browser: United States Net Generation, Annual.”
Used for 4,240 TWh U.S. generation in 2023.
(2) U.S. Energy Information Administration (EIA). “Electric Power Monthly.”
Used for early 2024 U.S. generation range of 4,150 to 4,200 TWh.
(3) Statistics Canada. “Electricity Supply and Disposition, 2022.”
Used for Canada’s 2022 generation of 636.2 TWh.
(4) Statistics Canada. Table 25-10-0015-01, “Electric Power Generation, Monthly.”
Used for Canada’s 2023 total (615.3 TWh) and approximate 2024 total (609.5 TWh).
(5) U.S. EIA and Canada Energy Regulator (CER). Public long term demand outlooks referenced in both agencies’ 2023–2024 planning documents.
Used for statement that both countries forecast the strongest load growth in decades.
(6) Reuters. “US power use to reach record highs in 2025 and 2026, EIA says.”
Used for record demand forecast and near term increases.
(7) ICF. “U.S. Electricity Demand Expected to Grow 25% by 2030.”
Used for 25 percent growth by 2030 and 78 percent by 2050.
(8) U.S. Department of Energy. “DOE Report on Data Center Electricity Demand.”
Used for data center demand rising from 176 TWh in 2023 to 325–580 TWh by 2028.
(9) Canada Energy Regulator (CER). “Canada’s Energy Future 2023: Current Measures Scenario.”
Used for Canada’s 2030 and 2050 generation requirements.
(10) CER and EIA long term planning documents, consistent with ICF and DOE analysis.
Used for combined North American requirement of 1,000 TWh (2030) and 2,000 to 3,500 TWh (2050).
(11) U.S. Energy Information Administration (EIA). “Annual Energy Outlook.”
Used for U.S. generation rising above 5,000 TWh by 2030.
(12) Canada Energy Regulator (CER). “Energy Future 2023: Current Measures.”
Used for Canada’s growth from 610 TWh to 680 TWh by 2030.
(13) Combined EIA and CER forecasts.
Used for continental requirement of ~1,000 TWh of new supply by 2030.
(14) Canada Energy Regulator (CER). “Annual Trade Summary: Electricity.”
Used for Canada’s electricity exports of approximately 36 TWh per year to the United States.
(15) World Nuclear Association. “World Nuclear Performance Report” and reactor performance data.
Used for AP1000 annual output of 8 to 10 TWh.
(16) Ontario Power Generation (OPG). “Darlington SMR Project.”
Used for BWRX-300 output of roughly 2 to 2.2 TWh annually.
(17) World Nuclear Association and recent U.S./Canadian project histories.
Used for typical 8 to 12 year build timelines for large reactors.
(18) International Atomic Energy Agency (IAEA). PRIS database.
Used for China’s typical 5 year construction timeline for large reactors.
(19) IAEA PRIS and WNA construction tracker.
Used for China having more than 20 reactors under construction and North America having none.
(20) Derived comparison using (15) and (16) plus aggregate demand forecasts from (10).
Used for equivalence of 100 to 130 large reactors or 450 to 500 SMRs needed by 2030.
(21) Same method as (20).
Used for equivalence of 200 to 350 large reactors or 900 to 1,700 SMRs needed by 2050.
(22) Nunatsiaq News. “What you need to know about hydroelectricity and the Iqaluit hydro plant.”
Used for Iqaluit project capacity of 15 to 30 MW.
(23) Nunatsiaq News. “Iqaluit hydroelectric proposal warrants ‘major project’ status.”
Used for project range and context.
(24) Nunavut government and project filings.
Used for cost estimate of 400 to 500 million dollars and commissioning by 2033.
(25) Canada Energy Regulator (CER). “Energy Future 2023: Current Measures Scenario.”
Used for Canada needing 300 to 350 TWh of additional supply by 2050.
(26) Ontario Power Generation (OPG). “Darlington SMR.”
Used for four unit plan (4 × 300 MW).
(27) Ontario government release. “Ontario leads the G7 by building first small modular reactor.”
Used for Darlington SMR timeline and performance details.
(28) Bruce Power. “The Bruce C Project.”
Used for potential 4,800 MW capacity and 38 to 40 TWh output.
(29) BC Hydro and Government of British Columbia. “Site C Clean Energy Project.”
Used for 1,100 to 1,200 MW capacity, 5.1 TWh annual output, and more than 16 billion dollar cost.
(30) International Energy Agency (IEA). “Electricity 2024: Global Analysis.”
Used for China adding 150 to 200 GW of capacity annually.
(31) IEA and China National Energy Administration.
Used for China adding 100 to 200 TWh of new output annually.
(32) International Atomic Energy Agency (IAEA). PRIS database.
Used for China consistently completing reactors in about 5 years.
(33) World Nuclear Association. “Nuclear Power in China.”
Used for more than 20 active reactor construction sites.
(34) Combined IEA and IAEA analysis.
Used for China adding the equivalent of two or three Canadas of annual generation within a decade.
(35) Canada Energy Regulator (CER). Energy profile data.
Used for Canada generating more than 60 percent of electricity from hydro.
(36) U.S. EIA. “Electricity Data Browser.”
Used for U.S. generation of 4,240 TWh in 2023 and projections for 2030.
(37) CER. “Annual Trade Summary: Electricity.”
Used for approximate 36 TWh annual exports from Canada to the U.S.
(38) Canadian and U.S. government publications on trade actions, industrial policy, and permitting regimes.
Used to support the statement about recent bilateral strain.
(39) Continental forecast synthesis from EIA, CER, and ICF.
Used for the 1,000 TWh (2030) and 2,000 to 3,500 TWh (2050) supply gaps.
(40) EIA and CER long term outlooks.
Used for statement that these figures represent official regulatory forecasts.