Introduction
Whether you are introducing data practices to an organization for the first time, or migrating data into a new system, having a data strategy helps create a culture that fosters proper data practices. However, as the application of data can vary across departments, it is important that organizations have a mechanism in place to determine if the data collected is ready for analysis. Ask yourself: What is the data? Where did the data come from? How can we use the data? Can the insights derived from the data be trusted?
If you torture the data long enough, it will confess.
– Ronald Coase
Without a clear data readiness foundation, these questions can derail or create doubt in any data analysis initiative.
But it doesn’t have to be that way.
Understanding your data readiness
Data readiness is the ability of a business unit to collect, curate and use data for operational and analytical purposes.
First, though, you need to establish where your organization sits on the data readiness continuum.
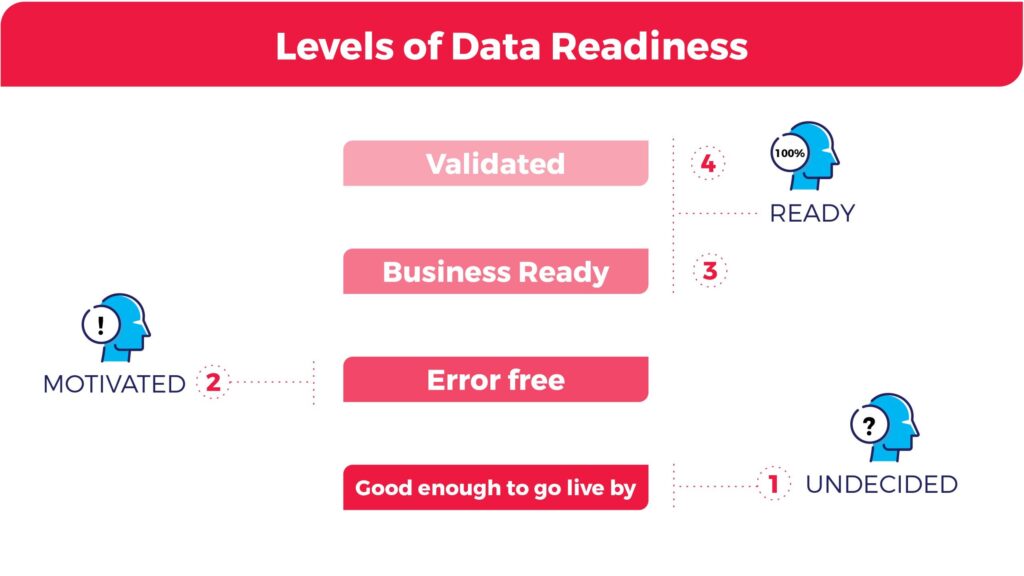
Organizations can be categorized into four levels of data readiness:
- Good enough to go live – Organizations in this stage are undecided on if they want to incorporate data into their business strategy. At this stage, the organization accepts data with a high error rate simply to get the system up and running rather than risk further delays. The organization is likely unsure how to get started with data and is trying to identify the first business use case. The data project has likely been extended beyond its estimated deadline and further postponing could cost the organization. Organizations that find themselves in this situation often have a weak data culture.
- Error Free – Organizations in this stage are motivated by the potential of data and are committed to ensuring that data is error-free. The organization has a data use case identified and believes that a data solution will add significant value to the business.
- Business Ready – Possibly the most difficult task in any large-scale data project is establishing when the data is business-ready. Error-free data is a step in the right direction, but what is more important is that the organization has the right data to better meet the business objectives of the organization. This means that not only is the data error-free and ready to be analyzed but also that the data will generate the desired result.
- Validated – For organizations in this stage, a lot of resources have been invested to ensure that data is error-free and that the right data is being collected and analyzed to ensure business objectives are being met. To ensure that the organization is adhering to legal restrictions, mechanisms are introduced that can validate and track data inputted into the system.
Why is data readiness important?
Data can be misleading. Not only is data open to human error, such as inputting information incorrectly, but it also can have quality issues that make data analysis ineffective.
For example, in 2008 Google created Google Flu Trends as a way to predict flu outbreaks in 25 countries. The company decided that the best approach to this problem was to analyze data collected from Google search queries about the ‘flu’ in particular regions and compare it to historic levels of flu activity to assess if a region had low, medium, high or extreme levels of flu.
However, at the peak of the 2013 flu season, Google Flu Trends produced results that were off by an incredible 140%. The company did not consider several other factors that were disguised in the data. What they failed to realize was that people searching for terms like ‘cold’ and ‘fever’ were not necessarily searching for flu-related diseases, but rather looking at seasonal diseases. Thus, even a data-driven company like Google can fall victim to the complexities of data.
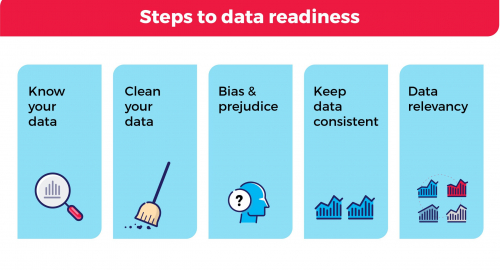
To ensure that your organization is prepared for data success, it is important to consider the following:
Know your data – Understanding the source of your data is a basic requirement prior to any data analysis. Where did the data come from? How was the data collected? What was done to the data? Why and by whom?
Keep data consistent – Standards on the input format, such as commas (3,500 or 3500), symbols, diacritics, date and time, currencies, addresses, etc. should be outlined in data governance policies. Uniform representation of basic data elements is integral to the success of business objectives and signifies sound data governance practices.
It is common practice to adopt standards that are native to employees across the organization. For example, a Canadian based company is more likely to report speed in kilometres per hour compared to an American based company.
Similarly, if data tools are being used to assist with an organization’s data transformation, it may be beneficial to adopt standards outlined in the application for organization-wide use.
Clean the data – Data entered incorrectly due to human error or lack of input restrictions can lead to ineffective data results. However, it is extremely important to distinguish between human input error and outliers in data. Outliers in data are observations that are abnormally distant from other values in a dataset. For example, it is uncommon for the height of a male adult to surpass 7 feet. If we opened a random dataset that had 100 observations of men’s height, what should we do with observations that are very distant from a majority of the data points – say 8 feet 11 inches? Or how about observations on the other end of the spectrum – say 21.5 inches? Although these heights may sound unreasonable, they could be true if the dataset included the world’s tallest man, Robert Wadlow, and the worlds shortest man, Chandra Bahadur Dangi. Before excluding any data from the analysis, it is important to understand what data isn’t qualified and what the impact is on the end result using statistical support.
Data relevancy – Is the data appropriate for the strategic question the organization is trying to tackle? Similarly, does the data fit a given analytics project? For example, if your organization’s business objective is to create high-quality clothing for Canadians, data collected on consumer preference in China will not be as relevant as data collected on consumer preference in Canada.
Bias and prejudice – Biases can occur at any time during an organization’s data transformation including data collection and data analysis. There are many different types of biases, such as confirmation bias –selectively accepting evidence to support specific claims, interpretation bias – interpreting data in a positive or negative fashion depending on variables used, etc., but the best approach to avoid bias in data is to be aware that such problems exist and take an objective stance when working with data.
By implementing tools outlined in this module, your organization has a higher chance of becoming data ready and uncovering data solutions that are actionable, have an impact, and most importantly, can be trusted.
Summary
Before your organization can use data for operational and analytical purposes, it’s important to understand the data readiness of your organization. Not all data and data results can be trusted to make important decisions. It’s important for organizations to have a data strategy that emphasizes the importance of proper data practices. For not-for-profit organizations with limited funding, data readiness increases the outcome of high impact projects as data is accurate, consistent, clean, relevant, and free of biases.
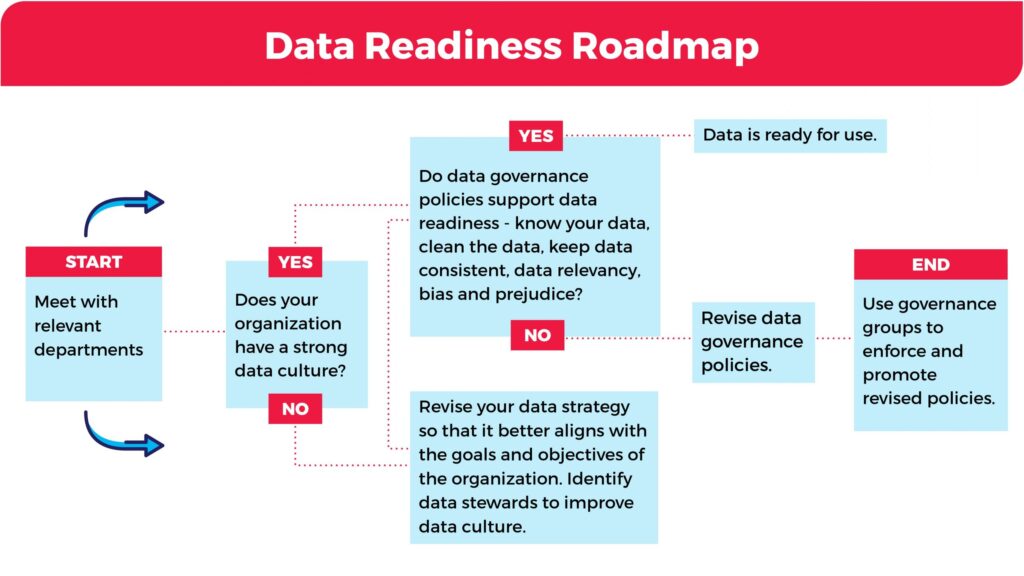
To improve the data readiness of your organization, refer to the roadmap below for next steps.