If the past year has taught us anything it’s that businesses must be nimble and ready to pivot based on changing trends or other factors. In order to thrive the marketplace companies have to know their customers, understand what they want and how to get it to them. In short, the companies that are going to win are the ones that have the data.
Digital analytics is one of the most valuable tools a marketer has available to them. By using them effectively, you can determine what tactics are working and which ones are not. Analytics can tell you about the audiences you’re engaging, how much they like your brand and what other interests they may have.
In short, budgets are tight, businesses or non-profits need to be as efficient as possible in their marketing efforts. To make sure you get the best return on investment it’s important to take advantage of all that your digital analytics have to offer. This will help ensure that your work is the most efficient it can be while maximizing the number of actions you want your target audience to take.
In this post we’ll cover measurement and analytics for the three most important channels that affect audience size and ability to convert:
- Website analytics
- Email marketing analytics
- Social media analytics
1 Website Analytics
The days of making faith-based decisions around your online presence are gone. By simply adding a little code snippet to your website you can unlock an enormous amount of data that can answer questions about your site, the visitors, what’s working, what’s not and what you can do.
With all this data comes the tendency to over-analyze or achieve “analysis-paralysis” brought on by too much data clouding your ability to take action.
Google Analytics, the company’s free web measurement tool is used by more than 83% of sites today. The reason is simple: it’s a robust, no-cost solution with a huge support base to help with questions or issues.
Throughout this module, the focus will be on Google’s tool, but the strategies and functions will be applicable to any other analytic tool.
Getting Started
If you don’t have a Google Analytics account sign-up for one:
- Set up a primary Google account that you can use with Gmail, Google Drive, Google Calendar, Google+, or YouTube. Then set up your Google Analytics using that Google account. Do it here: https://accounts.google.com/SignUp?hl=en
Tip: Don’t let anyone (your IT team, external web developer, etc.) create your website’s Google Analytics account under their own Google account so they can “manage” it for you. If you and this person part ways, they could take your Google Analytics data with them, and you may have to hunt them down and try to take over the account, or start all over.
2. Set up Google Analytics: The tool can be set up in minutes. Visit the page and find the instructions on how you can set up the tracking tool. If you’re not digitally inclined, speak to whoever manages your web presence, or any digital marketing consultant should be able to help you.
3. Optimize your setting: Here are a few configurations you’ll want to set up right away. With Google Analytics many of their filtering views are only operational from the date you turn them on, so it’s best to get the main collectors turned on right away, so you don’t miss out on your rich data.
- Set Goals: After you’ve set up the tracking code on your website, you will want to configure a small (but very useful) setting in your website’s profile called “Goal Setting”. It’s accessible via the Admin link at the top of your Google Analytics and then by clicking on “Goals” under your website’s “View” column.
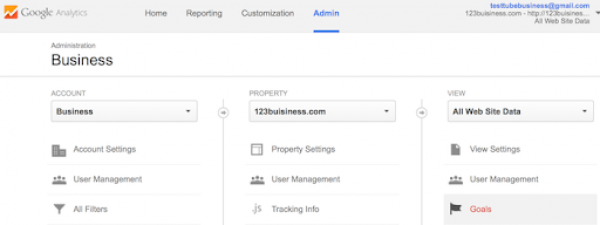
- Goal setting is a way to tell Google Analytics what is important to you from an audience action perspective. It could be a purchase, newsletter sign-ups, – any action you value. By setting up that goal, it will be easily trackable and allow you to get a clearer picture of the most effective (or ineffective) paths that users take to get to that action on your website.
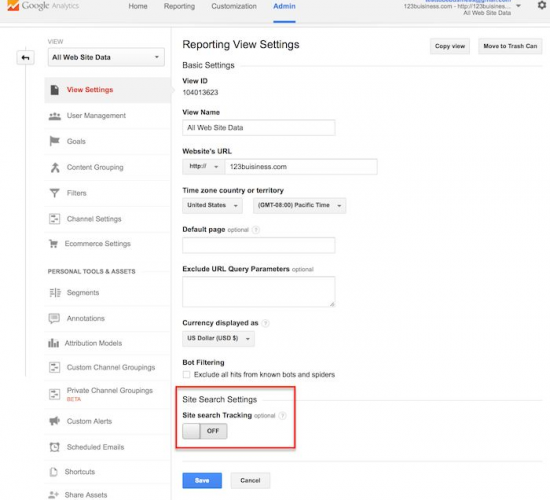
- Set up site search: Another important setting that will give you valuable data down the road is ‘Site Search.’ It will allow you to see how the search function on your website is being used. If users are searching consistently for a specific topic consider developing content to address this need. It’s accessible via ‘View Settings’ then at the bottom of the page you’ll see a toggle for ‘Site Search Settings.’
- Add other web properties you might have: If you have other websites, blogs or special event pages that are not based on the root URL that you’ve connected to Google Analytics, it’s a good idea to set them up as well. Again, this is to get a clear picture of how people are interacting with your brand’s digital properties. You can do this via the “Admin” menu, click on the drop-down menu in the “Account” column and click “Create New Account link”.
- Filter out internal traffic: You don’t want to skew your analytics with internal site traffic generated from inside the building, especially if numbers are low. Make sure to set up a filter to view external traffic only; you’ll still have access to numbers from internal visitors, but you’ll easily be able to toggle between the two views. Setting up this filter is a feature for an intermediate user; find instructions through Google’s support tools or contact a marketing consultant or other supplier who is experienced in configuring these types of features.
Now that you’ve configured your account, you need to wait 24 hours for it to start showing results from the data collected.
Measures that Matter: Analyzing your website data
When you start analyzing your website data remember that analytics will not have all the answers; in fact, it will often raise questions: “Why are people exiting the site on this page?’ or “why are they spending 5 minutes on page x?”. Your site analytics are insights; they are clues for you to investigate and turn into actions that will help you better reach your goals and serve your customers.
Here are the basic measures to pay attention to when starting out with your analysis — most of them are available on the “Home” dashboard when you enter your analytics page.
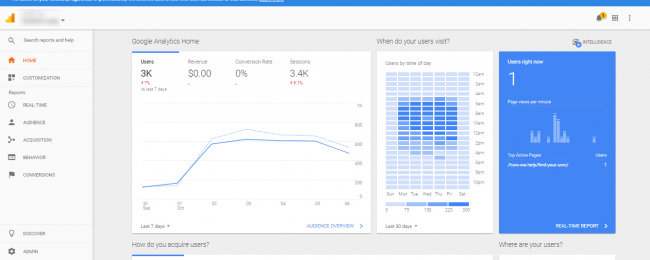
- Traffic: The number of visits and visitors to your website, reported as sessions and users. Most often referencing the number of visits (sessions) to your site.
Tip: You’ll want to keep an eye on your reach and growth, are you driving new users to the site through other strategies? What channels are most effective (social media, email, other)? What is the split between new visitors vs returning visitors?
- Consider bounce rates: the percentage of single-page visits (or web sessions) in which a user leaves your website from the landing page without browsing any further. This number can vary from 25% – 65% depending on the industry so don’t get too worried by it. If you’re seeing abnormally high numbers do some investigating: Why did they leave? Could they not find what they were looking for? Did the page they landed on not interest them?
- Conversions: This is one of the most important measures. If you have your goals set up to track monetary conversions (donations), then it will be one of the first things you see on your dashboard. Slice and dice the data based on users/pages/time of day. You want to drill down and identify specific targetable characteristics of users or their experience that can be replicated so you can drive even more revenue.
- Audience location: This is a good measure to review regularly to get a sense of where site visitors are geographically located. For the most part, your messaging and tactics will be designed to engage local communities. If you’re in a smaller market and are seeing engagement outside of your core area, it may be something to consider adjusting in your strategies.
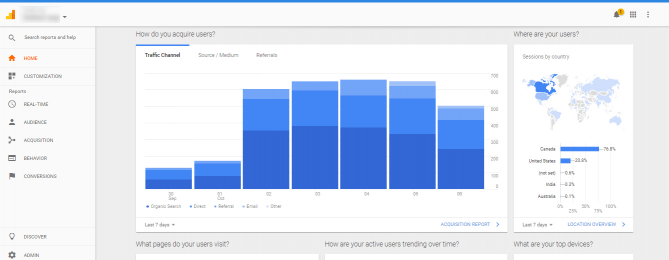
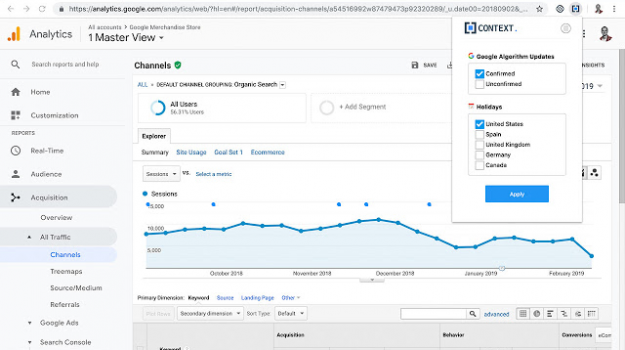
- User acquisition: Understanding how users are getting to your site is important in assessing the value of channels in your marketing mix and where to devote resources. This metric will help you see the varying ways people are arriving on your site:
- through search (organic);
- typing your address into the browser (direct);
- clicking a link on another site (referral); or
- other channels like social media or email.
- Visitors by device: The type of device people use to browse your site will determine your focus with respect to creating online experiences. A site with a significant increase in mobile visitors will want to scale back on copy and ensure that their user interface is optimized for that device.
Tip: Expect to see the number of mobile visitors to your site continue to steadily increase — make sure your site is optimized for mobile now.
- Exit Pages: This is not an item on the main analytic dashboard page, but easily found under the ‘Behaviour” tab under “Site Content”. What pages are driving people away and why? Use these metrics to find gaps in your content or poorly developed experiences and fix them.
- Tip: When trying to decode exit pages look at the path that people have taken to get to that page to better understand what their motivations were. Use secondary variables like “Last page” to gain clarity.
- Content Trends: Be sure to look at how the most popular pages on your site are performing under “Behaviour” and “Site Content”. Take note of high performing pages versus low performing ones. What’s the difference? How can you improve poor pages?
- User Flow (advanced): More advanced users can take advantage of the “User Flow” view to understand the path that visitors are taking on your site. It can help inform who they are, what their motivations and interests are, and what they need from you to complete an action (donate, volunteer etc.) This data can also be useful in validating thinking around the creation of user personas; see the ‘Content Marketing’ learning module for more details.
The measures listed above are just some of what is available through your website analytics. Be curious, look for success and failures to truly drive your digital marketing strategy forward.
Tip: One of the best investments you can make for yourself or your staff is to learn more about Google Analytics to truly harness its power. Google offers a free course through its Analytics Academy that will train you on Google’s measurement tools so that you can grow your revenue through intelligent data collection and analysis.
Net Promoter Score: Measuring Visitor Experience
In the digital marketing world the net promoter score (NPS) has become one of the most valuable metrics for leading corporations like Apple, eBay, LinkedIn and others.
The NPS is the one-step customer satisfaction survey that helps determine customer loyalty and a company’s future growth.
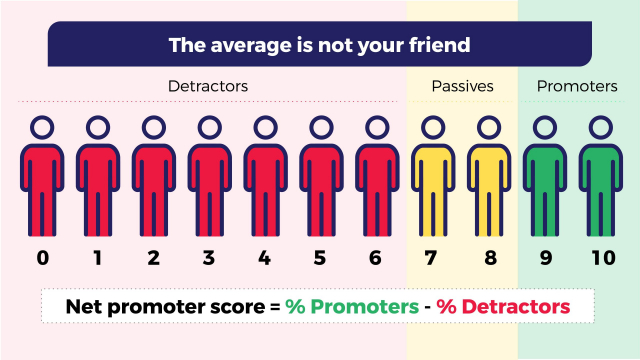
- Ask your customers, “How likely are you to recommend [company, product, or service] to your friends or colleagues?” on a 0 to 10 point scale.
- Divide your customers into “Promoters”, “Passives”, and “Detractors”. Promoters give a score of 9 or 10, passives 7 or 8, and detractors 0 to 6.
- Subtract the percentage of promoters from the percentage of detractors. Ignore the passives. This is your company’s NPS.
- Quality: It measures quality in a reliable way, from the perspective of the user.
- Feedback: It provides simple, actionable feedback and can provide insight into how to improve your organization, programs and/or services.
Tip: Check out more details on where/why you should get started with NPS.
2 Email Marketing Analytics
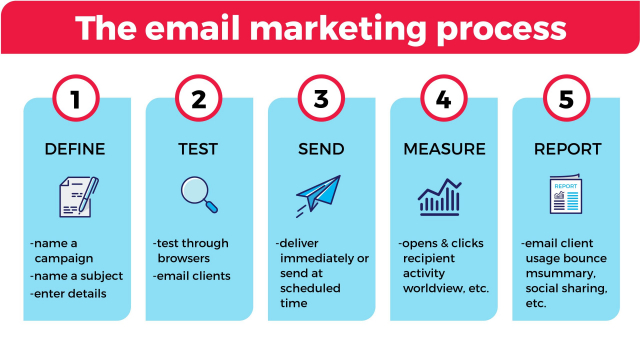
Whether you use MailChimp, Constant Contact, SendinBlue or another email marketing tool, measurement is a key step in your overall email marketing process.
Here are the five measures you need to pay attention to:
1. Clickthrough Rate (CTR): The percentage of email recipients who clicked on one or more links contained in a given email. CTR is the most important metric when evaluating the success of any email. The average for organizations according to MailChimp is about 2.62%; that number will vary across markets and audiences. Establish your own CTR baselines and track them in your email analysis. Any email you send should have a call to action (CTA) in it — a button that recipients click to donate/sign-up/share or any other action you want them to take. If you don’t have a CTA in your email, you need to consider why you are sending it in the first place, and what (if any) value it provides to your recipients
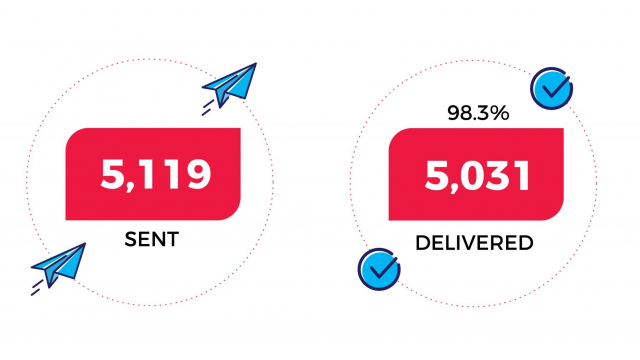
2. Bounce Rate: The percentage of your total emails sent that could not be successfully delivered to the recipient’s inbox.
Not all bounces are created equal, most email marketing systems will display two versions:
- Soft bounces: the result of a temporary problem with a valid email address, such as a full inbox or a problem with the recipients’ server. The recipient’s server may hold these emails for delivery once the problem is addressed, or you may try re-sending your email message to soft bounces.
- Hard bounces: the result of an invalid, closed, or non-existent email address – these emails will never be successfully delivered. You should immediately remove hard bounce addresses from your email list because internet service providers (ISPs) use bounce rates as one of the key factors to determine an email sender’s reputation. Having too many hard bounces can make your company look like a spammer in the eyes of an ISP and could get you banned (temporarily or permanently) from sending emails.
Clear up bounces where possible and keep those lists clean.
3. List Growth Rate: Have a newsletter sign-up option on your website? Ideally, it writes back directly to your email system database so you can monitor sign-ups. Track the growth rate, especially as it compares to the unsubscribe rates of your emails, and determine if the experience on the website is optimized, or if enhancements could be made that will increase the number of new sign-ups.
4.Email Sharing/Forwarding Rate: Do your emails allow recipients to share the content with others via social media or other means? This type of word-of-mouth marketing is a great way to grow your list and understand what content delights your email recipients.
5.Return on investment (ROI): This one may be a bit more difficult to track as it involves the email channel results and the overall level of effort it takes to produce and distribute it. Take a good look at what you’re getting out of your current email marketing strategy; dig into the data and quantify the results. Having an email list of 10,000+ unengaged subscribers doesn’t matter if your click-through rate is 0.5%.
If the ROI isn’t there consider re-evaluating your strategy and trying something new. Just because you’ve always done something a certain way and there is perceived value from an organizational perspective doesn’t mean there is any value to your donors. If you can’t measure it, how can you value it?
A few email marketing analytics to banish from your organization
Open Rate: Marketers used to love to tout “open rates” as a success measure, but in fact, it was just a digital version of traditional “reach.” The problem with open rates is that email systems don’t all track an “open” the same way. Some email systems don’t count emails viewed in the preview pane as an “open”; others only count an “open” when images embedded in that message are loaded — something that may not be possible for many due to image-blocking features enabled on their email client.
Most importantly though, opens are not a reliable metric because they don’t speak to the action you want people to take upon receiving the email. That is how you measure email marketing success — how many people completed the desired action (e.g. purchased a product or signed-up to a email list) These types of engagements help measure true success.
Unsubscribe Rate: Just like open rates, the unsubscribe rate isn’t a reliable picture of the effectiveness of your email campaigns. Often recipients won’t bother to go through the unsubscribe process; they’ll just delete the emails without opening or clicking on anything. Don’t spend too much time fretting about unsubscribes (unless you have major spikes — then figure out why) instead, focus on gauging engagement levels of your recipients and work on increasing those numbers to avoid unsubscribes altogether.
To summarize email marketing, pick the metrics that matter to your organization, make sure they are ones that you can have an impact on, and continue to monitor, measure and innovate. If you do these things, you’ll be on your way to an effective email marketing campaign.
3 Social Media Analytics
There’s no question that social media platforms represent a great opportunity to draw attention to your organization and the work that you do. But, your efforts around social media must be tied to measurable results to get the most efficient return on investment.
Potential donors today are looking for increased levels of communication and transparency from charities. As a result, your organization’s social media presence has gone from a “nice-to-have” to a “must-have”. Customers and potential customers will turn to social media to get information about your organization, your goals and to make a donation.
“54% of social browsers use social media to research products.”
-GlobalWebIndex
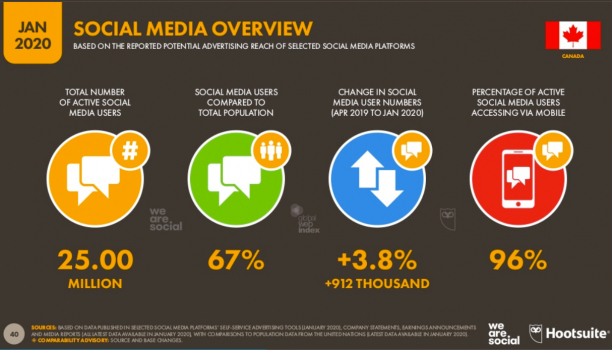
With more than 25 million social media users in Canada alone (source: we are social) the landscape is crowded with companies jockeying for position, your social media game needs to be strong. Social media success can only be determined through effective and consistent measurement.
Key social media metrics you need to pay attention to:
1.Reach: How far are your messages and content going? How many people are you reaching? Reach measures potential audience size, and in many cases the larger the audience, the better but it’s not the whole story. Track this metric in connection with the next key metric: engagement. A smaller, more engaged audience is always going to beat out a large, unengaged one when it comes to driving action.
2.Engagement Measures: How are people engaging with your posts, what are they doing to participate? Are they “liking”, “sharing”, “retweeting” or taking some other type of action to show their support and promote your brand to their network? Examine your social media insights and track who is engaging with your posts and which posts are the most effective for driving that action and replicate the success.

3. Influencers: This measure can be two-fold:
- Who are the people or brands that are sharing your content with their network and getting the greatest return?
- How influential is your organization around specific topics in the social media space?
Influence is both widely misunderstood and very controversial. For your efforts, avoid analyzing the dozens of influencer scoring tools or other metrics that claim to represent influence. Instead, stick to the metrics that tie back to your goals. Build stronger relationships with followers who are influential and are currently sharing your content. Seek out and build relationships with those who currently aren’t sharing your content but who are influential amongst the audience you are targeting — as long as their views align with your values.
What measurement tools to use?
There is no shortage of social media measurement tools on the market today. Choosing the right one to fit your organization’s unique needs will be based on many factors. For most, the stock metric tools provided by Facebook, Twitter and other platforms will be enough. Pair them with the data you can pull from your Google Analytics website dashboard, and you’ll have a good understanding of what platforms are driving people to your site and which ones are completing the conversion actions you want.
For larger, more advanced organizations consider using a third-party tool to help facilitate the collection and interpretation of your social media data. A quick Google search will provide some options.
Summary
Planning and consistency are two essential requirements for effective measurement. Determine your success measures that are tied back to your overall goals and start tracking. Use the same methodologies to calculate these measures and repeat them regularly so that you can analyze changes over time and address any significant “ups” or “downs” in results. By doing this, you are building a strong foundation of data that can move your organization forward.